- Support
- User Guide
- Charts And Reports
- Creating A Chart
TreeView User Guide
Creating a chart
TreeView has a range of reports and charts you can generate, allowing you to display the information about your family tree in different ways. They are ideal for sharing with others.
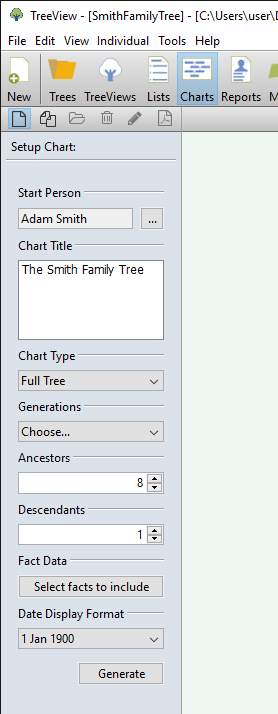
- To create a chart, click the 'Charts' button on the toolbar.
- You can then choose the options for the chart using the panel on the left hand side:
- Start Person - choose the start person for your chart. For example, if you want to generate a chart of descendants from a particular person, choose this person as your start person.
- Chart Title - choose a title for your chart, for example "The Smith Family Tree".
- Chart Type - select the type of chart. These range from an 'Ancestors' chart which will show a direct line of ancestors of the 'Start Person' you have selected, to a 'Full Tree' which can show all individuals in the 'Start Person's' tree, including aunts, cousins, siblings, etc.
- Generations - Choose how many generations you would like to show on the chart. The more generations you select, the larger the chart will be.
- Fact Data - click the 'Select facts to include' box to choose which facts you want to include on your chart. You may like to show just a birth and death date, however you can also include any other facts you have entered, such as a baptism or an occupation.
- Date Display Format - choose how you would like the dates to appear on the chart.
- Click 'Generate' to generate the chart.
Back to User Guide
TreeView™ ©Genealogy Supplies (Jersey) Ltd 1992-2026. All rights reserved.